We care about correctness in the Probabilistic Grammar of Graphics: the proportions of visual elements (such as counts or areas) and their spatial placement should reflect the underlying probability distribution. Here I sketch an induction proof that shows PGoG should produce correct visualizations (in terms of area).
PGoG specification includes probability expressions. If we sort them by the length of their conditional variables, a specificiation can have the following form:
aes[1] <- P(A)
...
aes[n] <- P(X|A, ...)
aes[n+1] <- P(Y|A, ..., X)
Sketch of proof
Basis
We start from level = 1, where we have the entire canvas and the first line of the specification aes[1] <- P(A).
Suppose the random variable A has levels \(a_{i}, i \in 1,..., A\).
Partition the canvas in the aes[1] direction, (i.e., width or height) to get \(area_{1,i} \propto P(A = a_i)\). The resulting visualization is correct.
TODO: insert some visualizations
Inductive Step
level = n
aes[1] <- P(A)
...
aes[n] <- P(X|A, ...) # n lines of specs
Suppose the visualization is correct up to level = n. At level = n, the random variable \(X\) has levels \(x_j, j \in 1...M\). We also suppose that \(\forall area_{n,j}\) correctly partitioned, i.e., \(area_{n,j} \propto P(A=a_i)...P(X = x_j), j \in 1...M\). Better still, all \(area\)s should be correct for \(\forall n\), so the entire visualization is still correct.
level = n + 1
aes[1] <- P(A)
...
aes[n] <- P(X|A, ...)
aes[n+1] <- P(Y|A, ..., X) # n + 1 lines of spec
\(Y\) has levels \(y_k, k \in 1...N\). We want to show that \(area_{n+1, k} \propto P(A=a_i)...P(Y = y_k)\); each partition is proportional to the joint distribution of \(A, ..., X ,Y\).
For each partition \(area_{n,j}\), partition in the aes[n+1] direction, (i.e., width or height) to get \(area_{n+1, k} \propto P(Y = y_k), k \in 1...N\). Since \(area_{n,j} \propto P(A) ... P(X = x_j)\), it follows that \(area_{n+1, k} \propto P(A=a_i)... P (X= x_j) P(Y = y_k)\).
□
Generalizing the proof
The steps above mainly apply to constructing area plots. For variants of icon arrays, we can modify the proof as:
- partitioning/faceting along x and y axes are handled the same way
- replace \(area\) with count of icons, so \(count \propto P(A=a_i)\), etc.
- overall, the number of icons in a group (e.g., within the same partition and of the same fill color) should be proportional to the joint probability \(P(A=a_i, ..., X=x_j, Y=y_k)\). In addition, the partitions of the icons, such as grouping them into the shape of a bar chart, approximately reflect marginal distributions at higher levels.
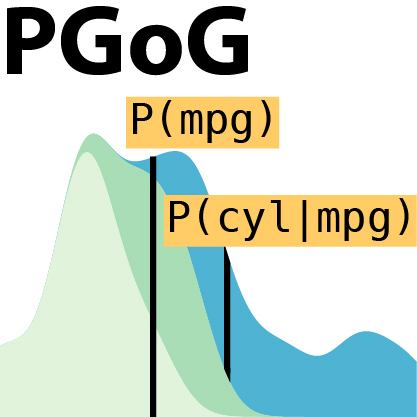
A Probabilistic Grammar of Graphics.
Xiaoying Pu, Matthew Kay. CHI 2020. (Conditionally accepted).
[PDF]